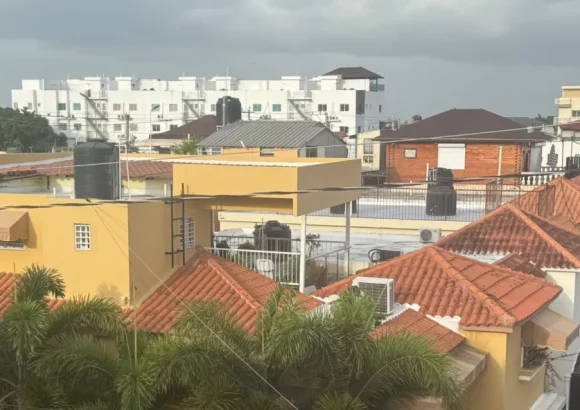
Fresh 2026 first semester construction data from the Dominican Republic paints a nuanced picture of development activity across Greater Santo Domingo, highlighting stark disparities in project density and total built area across the region’s municipalities and neighborhoods. When ranked by raw number of active projects, Santo Domingo East claims the top spot by a wide margin, with 2,271 ongoing initiatives that make up 34% of all construction in the entire Metropolitan Region. It is followed by Santo Domingo Norte with 1,047 projects, the historic core of Santo Domingo de Guzmán with 898, and Los Alcarrizos with 819. Combined, these four leading municipalities account for nearly three-quarters — 75.4% to be exact — of all active development across the Greater Santo Domingo area.
However, the ranking shifts dramatically when measured by total constructed square footage, a metric that reveals differences in project scale across jurisdictions. Santo Domingo de Guzmán, the capital’s historic and commercial core, leads this category with 3,201,442 square meters of active construction area, representing 40.8% of the region’s total built space, despite hosting only one-third of the number of projects counted in Santo Domingo East. Santo Domingo East follows with 2,284,800 square meters, equal to 29.1% of the total, while Santo Domingo Norte contributes 1,430,648 square meters (18.2%). Together, these three municipalities hold 88.1% of the region’s total active construction area, while outlying San Antonio de Guerra accounts for just 0.7% of the total.
Breaking down the data by project size, the National District, which encompasses Santo Domingo de Guzmán, dominates mid-sized development: it holds 61.7% of all projects between 2,001 and 5,000 square meters, and 66.8% of projects in the 5,001 to 15,000 square meter range. Uniquely among Greater Santo Domingo’s municipalities, the National District also sees more ongoing active construction (47% of registered projects) than halted projects (33.1%), signaling steady, sustained growth in the area.
At the neighborhood level, leadership depends entirely on which metric is used. By count of individual projects, Los Frailes takes first place, representing 4.8% of all active initiatives in the region. It is followed by Guerra Centro with 4.1%, Andrés with 3.8%, and Sabana Perdida with 3.6%. The top 20 neighborhoods by project count account for just over half — 50.5% — of all active construction in Greater Santo Domingo.
When ranked by total square footage of active construction, a very different group of neighborhoods rises to the top. The outer suburban neighborhood of Guaricano leads with 718,404 square meters, followed by another outer neighborhood, Cancino Afuera, with 579,732 square meters. Sabana Perdida, also an outer suburban community, claims third place with 473,795 square meters, followed by the upscale central neighborhoods of Piantini (456,894 square meters) and Ensanche Naco (424,507 square meters). Combined, these top five neighborhoods hold 2.7 million square meters of active construction, equal to 33.8% of the region’s total active area, and the top 20 neighborhoods by square footage account for 69.3% of all built space.
Analysts note that the dual leadership of these two distinct groups of neighborhoods reveals the two parallel directions of Greater Santo Domingo’s current construction boom: dense, high-value development in well-established central neighborhoods such as Piantini, Ensanche Naco, Bella Vista, and La Esperilla, and large-scale mass housing development on the city’s expanding suburban periphery, represented by Guaricano, Cancino Afuera, and Sabana Perdida. Observers emphasize the importance of distinguishing these two separate development trends to accurately track the city’s growth.
Looking across the entire 2026 first semester period, the data reveals an unexpected overall trend: the total number of registered construction projects fell 4.3% compared to the previous six-month reporting period, even as the total area under construction increased. The Dominican Republic’s National Statistics Office (ONE) attributes this seeming contradiction to two key factors: the registration of large-scale government-backed affordable housing developments, which are far larger in area than the average private project, and a recent influx of new large-scale projects that are just entering the planning phase, skewing the size of the overall active construction pipeline.